Spot Melting with Back-Scattered Electrons Detectors
Goal
The simulation of a single spot on a bare plate material.
The material of the plate is Ti6Al4V.
Run
Copy the JSON file provided with the usercase into the simulation folder.
> cp <path>/EBM_sensors.json .
Run the code from terminal with the provided JSON file. You may need to edit the information on the license file in it.
> INPUT_JSON_FILE=EBM_track_plate.json /opt/KiSSAM/start_calc.sh
Make sure that simulation is started by making sure there are no fatal errors in the .log file that has appeared.
It might be necessary to insert the correct license filepath.
Input Configuration
The simulation parameters can be adjusted by editing the JSON file.
 1{
 2   "licenseFile":"/licences/kissam-end-2024-dec.lic",
 3   "outputDir":"./drop",
 4   "config":{
 5      "AllowToRunoutXYbox":true,
 6      "IterationSubstepsRate":100,
 7      "AutoTermination":true,
 8      "MemoryAllocation":"managed",
 9      "DumpARR":false,
10      "DumpDataRate":20000,
11      "DumpVTK":false
12   },
13   "Material":"Ti6Al4V",
14   "ScanStrategy":{
15      "Type":"SingleTrack",
16      "SingleTrack":{
17         "startPosY":0.0006,
18         "length":1e-09,
19         "startPosX":0.0006
20      },
21      "Beam":{
22         "Shape":"Gauss",
23         "Width":0.0005,
24         "ElectronsEnergy":60000,
25         "Power":900,
26         "type":"Ebeam",
27         "Speed":3.125e-06,
28         "RaysPerCell": 100
29      }
30   },
31   "Sensors":{
32      "Default":{
33         "DetectType":"Electrons",
34         "Size":0.001
35      },
36      "Array":[
37         { "Origin":[ 0.006, 0.006, 0.3006 ], "Size":0.05 },
38         { "Origin":[ 0.2302, 0.006, 0.1933 ], "Size":0.05 },
39         { "Origin":[ 0.2902, 0.006, 0.0782 ], "Size":0.05 },
40         { "Size":-1, "Origin":[ 0, 0, 0 ] }
41      ]
42   },
43   "Camera":{
44      "temperature":1023,
45      "pressure":1,
46      "AmbientGas":"Ar"
47   },
48   "Substrate":{
49      "preheating":1023
50   },
51   "sizes":{
52      "FullXapprox":0.0012,
53      "FullYapprox":0.0012,
54      "FullZapprox":0.001,
55      "substrate":0.0006
56   }
57}
The parameters that are not specified here are taken from the /opt/KiSSAM/default.json file.
Here we turned off the output of vtk files which contain temperature distribution and arr files to save on the storage taken by the simulation output. The config.Autotermination option is used to terminate the calculation when the beam is turned off and all material is solidified. For the EBM simulation, the ambient gas temperature and pressure are specified.
To simulate spot melting with available interface options, the scanning strategy type is set to SingleTrack, while the length of the track is one nanometer.
The beam is turned off after SingleTrack.length / Beam.Speed, which is \(10^{-9} \text{m}/(3.125\cdot10^{-6} \text{m/s})=320\) microseconds.
The simulation takes place in a \(1.2\times 1.2\times 1\) mm domain. The spot is melted at \((x,y,z) = (0.6,0.6,0.6)\) mm.
The beam has a Gaussian profile, \(D_{4\sigma} = 0.5\) mm, its power is 900W.
Sensors Configuration
In the input JSON, we have put the three sensors numbered 0, 1, and 2. The first one is exactly 30 cm above the melted spot, and two more are at the same distance but at a different angle. The size in 5 cm, which means that any electron that passes at a \(5/2=2.5\) cm distance from the sensor is counted.
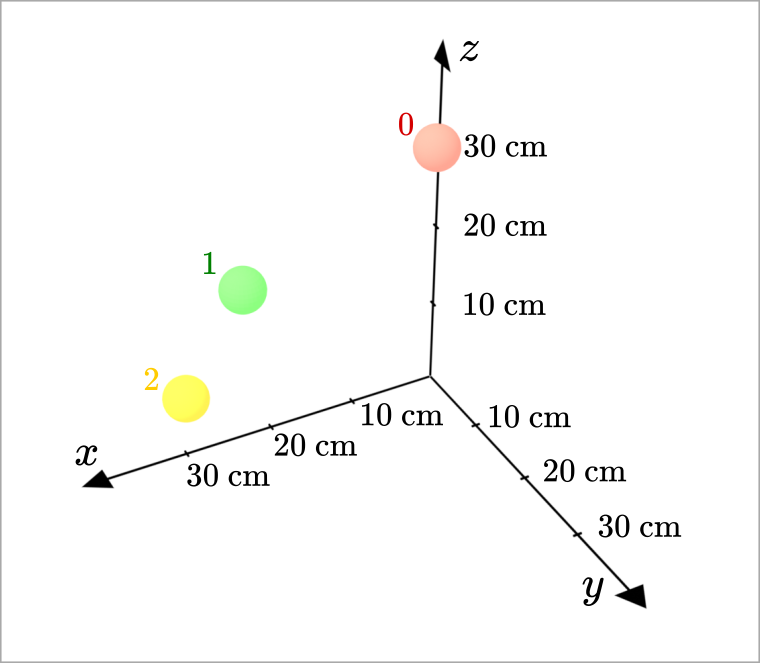
Fig. 48 Sketch of the detectors position and size. The size of the simulation domain (\(\approx 1.2\) mm) is too small for it to be shown on the figure; it is located at \((x,y,z)=(0,0,0)\)
The fourth sensor size is set to \(-1\). This sensor counts every electron that left the material.
In the default settings, electron which fall on each cell are simulated with one ray, which is scattered in the material.
To decrease noise in the detector reading, it is recommended to increase this parameter: ScanStrategy.Beam.RaysPerCell.
The value should be a perfect square: 1, 9, 49, 100, etc.
In this example, it is set to 100.
Warning
To get accurate counts of backscattered electors, it is important to increase the ScanStrategy.Beam.RaysPerCell parameter. This, however, increases the computation time.
Simulation Results
The simulation runs for ~15 hours. Note that the time is due to sensors setup. Without detectors, and with one electron ray per mesh cell, the same simulation lasts for less than 3 hours. The default name for the simulation output directory is drop.
3D view
The track geometry is stored in the openVDB format output/geometry.vdb.
It is updated during the simulation process and stores the latest state.
View it with Blender or VDB view.
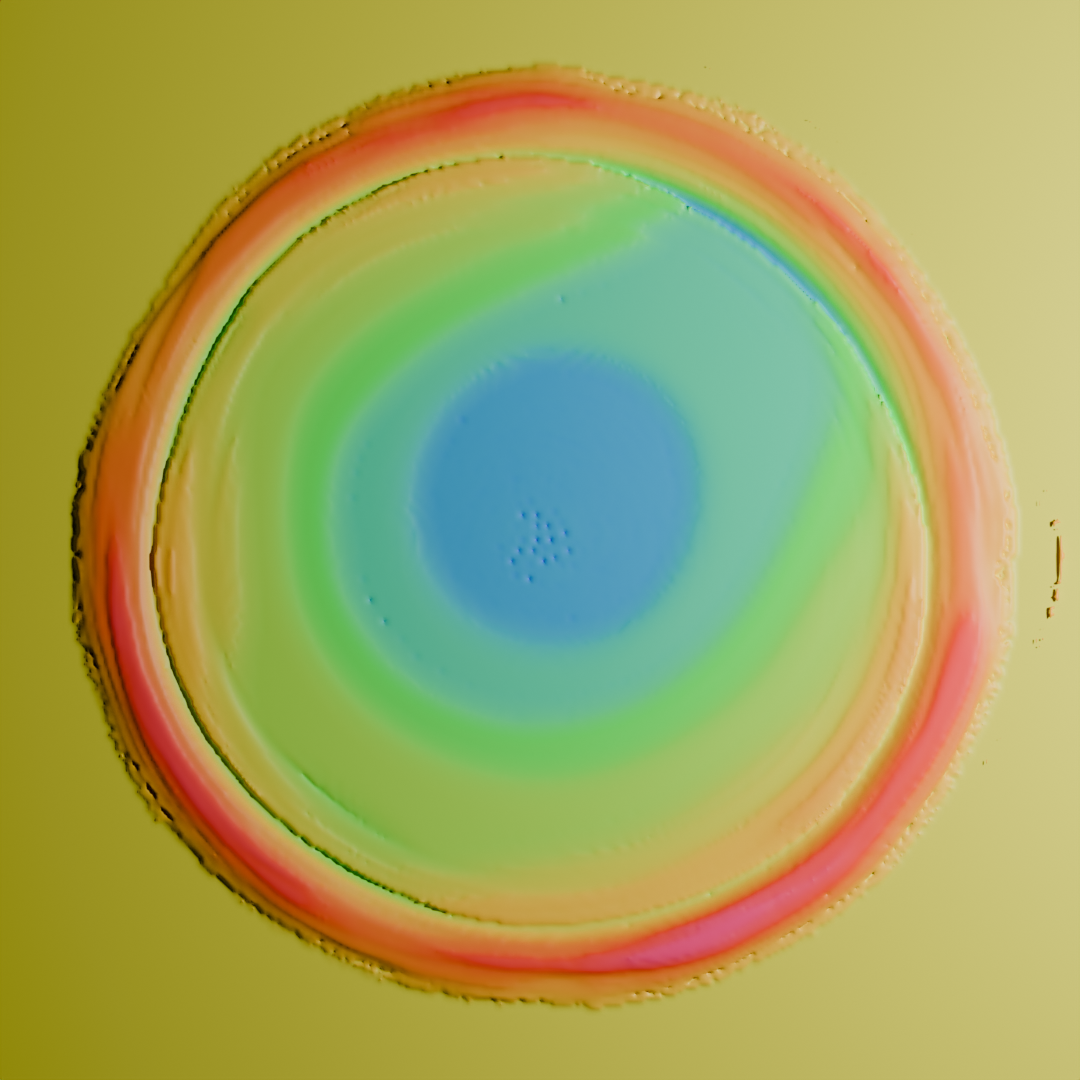
Fig. 49 openVDB file loaded and rendered in Blender. Height map in colors.
Images and animation output
The meltpool states are rendered as images and stored in output/rendered3D.
The images of cross-sections are found in output/cross-sections.
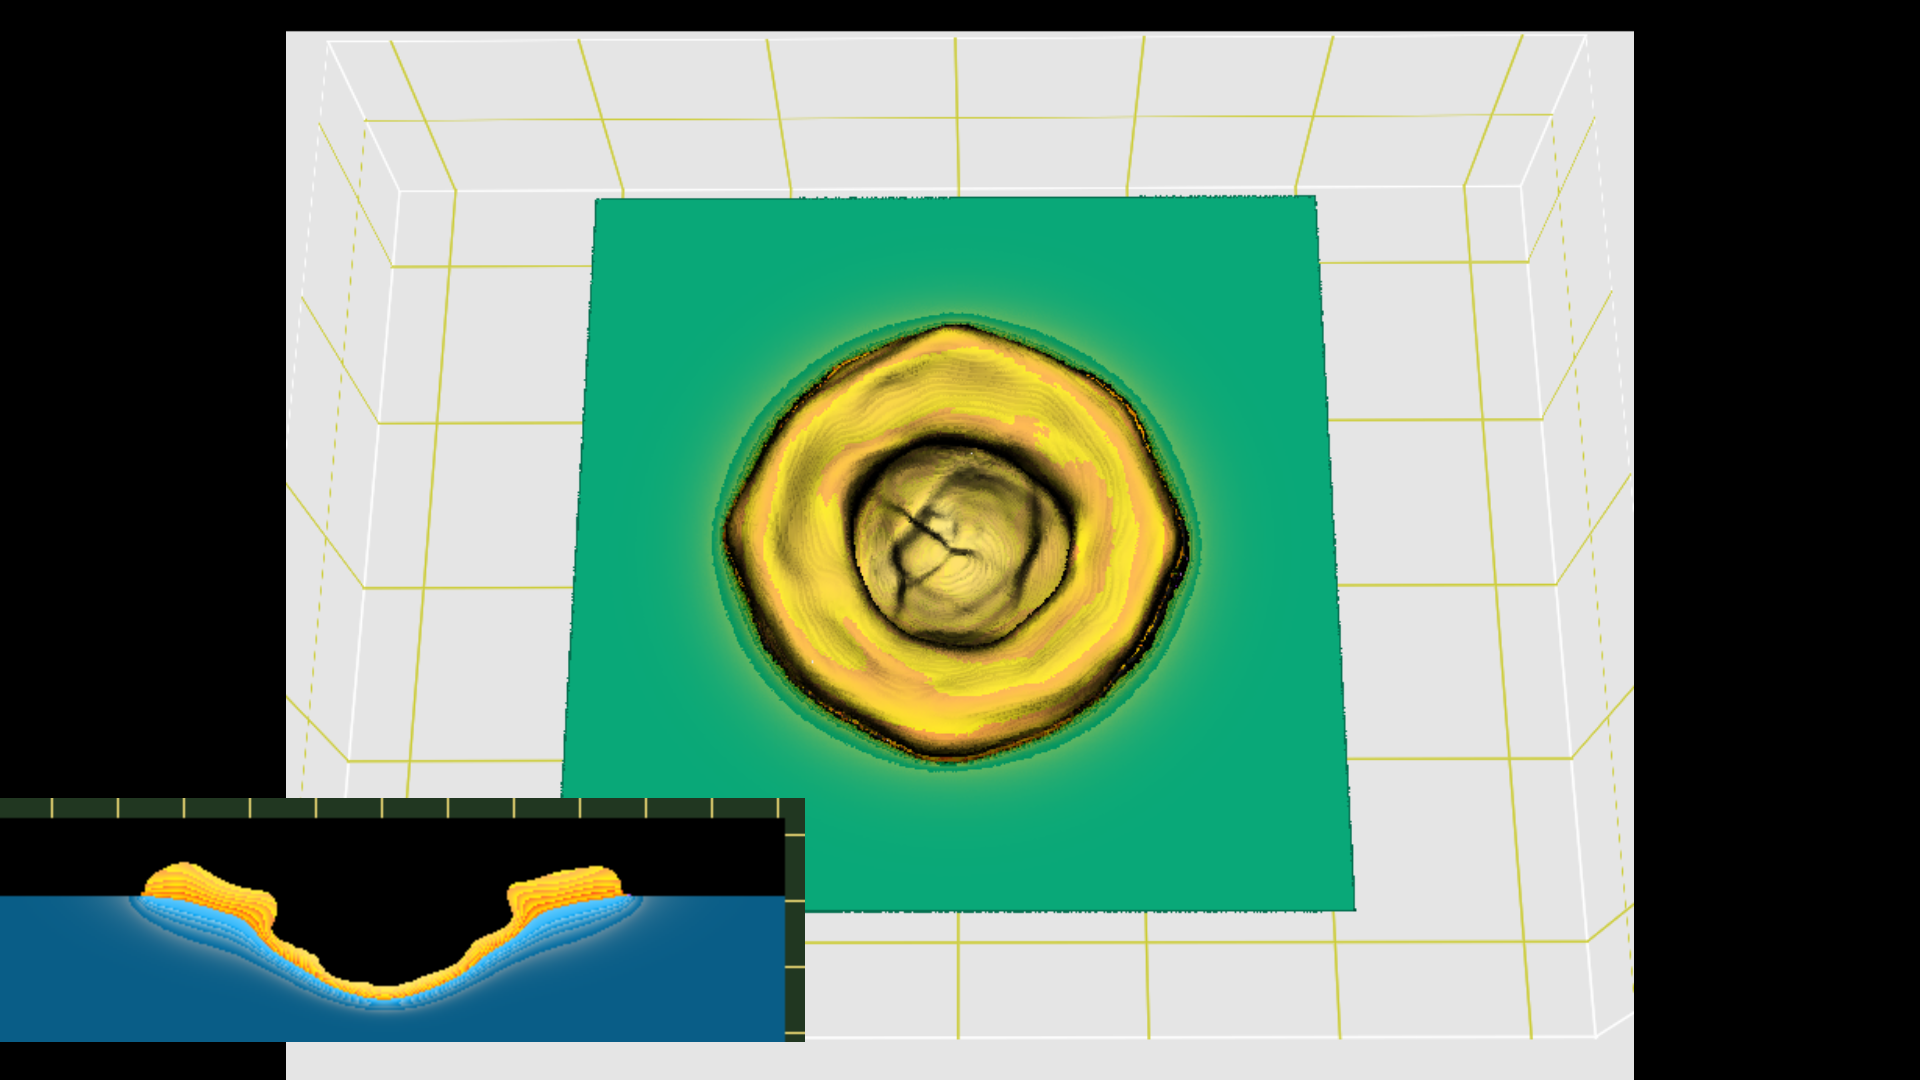
Fig. 50 The images at 60-th frame in the simulation (pic6000.png) with the corresponding cross-section image.
Orange is fluid, blue is solid, purple is solidified fluid. The visible lines are temperature isocontours. The distance between yellow tics is 100 μm.
Fig. 51 Click on the image to view the video
Detectors Output
Let us look at the drop/sensors.dat file in the simulation output.
It contains four columns:
92.37400394155281 57.79816921861202 17.49061120256303 12896.519808240357
111.64910256150247 69.33236905445088 20.582454818619563 14990.262861076708
111.75001896791095 69.45556761381944 20.79526988908518 14996.863657395235
111.30698233664074 69.83385851273921 20.882815195848778 15007.286637515188
111.05728069855324 69.59773041167973 21.615380964321027 15067.02534799527
111.01092183040586 70.08750533751696 21.49080585759316 15051.95991306842
...
Each column corresponds to one detector, in the order they are defined in the input file.
Each value is the power of electrons, collected in the time period of config.IterationSubstepsRate time steps. Here, it is \(100\cdot 3 \cdot 10^{-8}= 3\cdot 10^{-6}\) seconds.
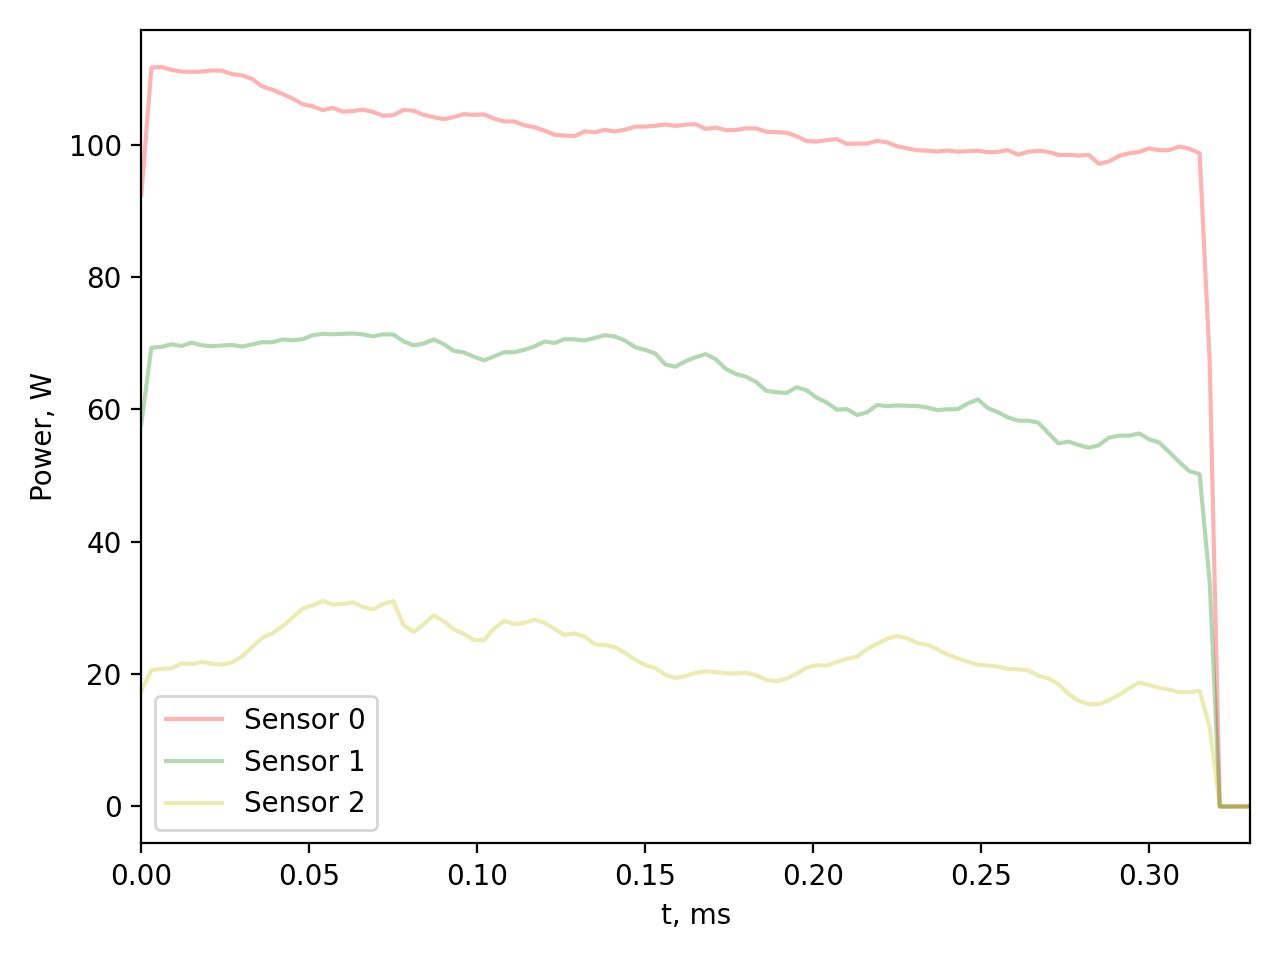
Fig. 52 Sensor data from the Sensors.dat file, first three sensors.
The values in the last column are large if compared with the others. This is because the last detector was configured to count every electron that left the material.
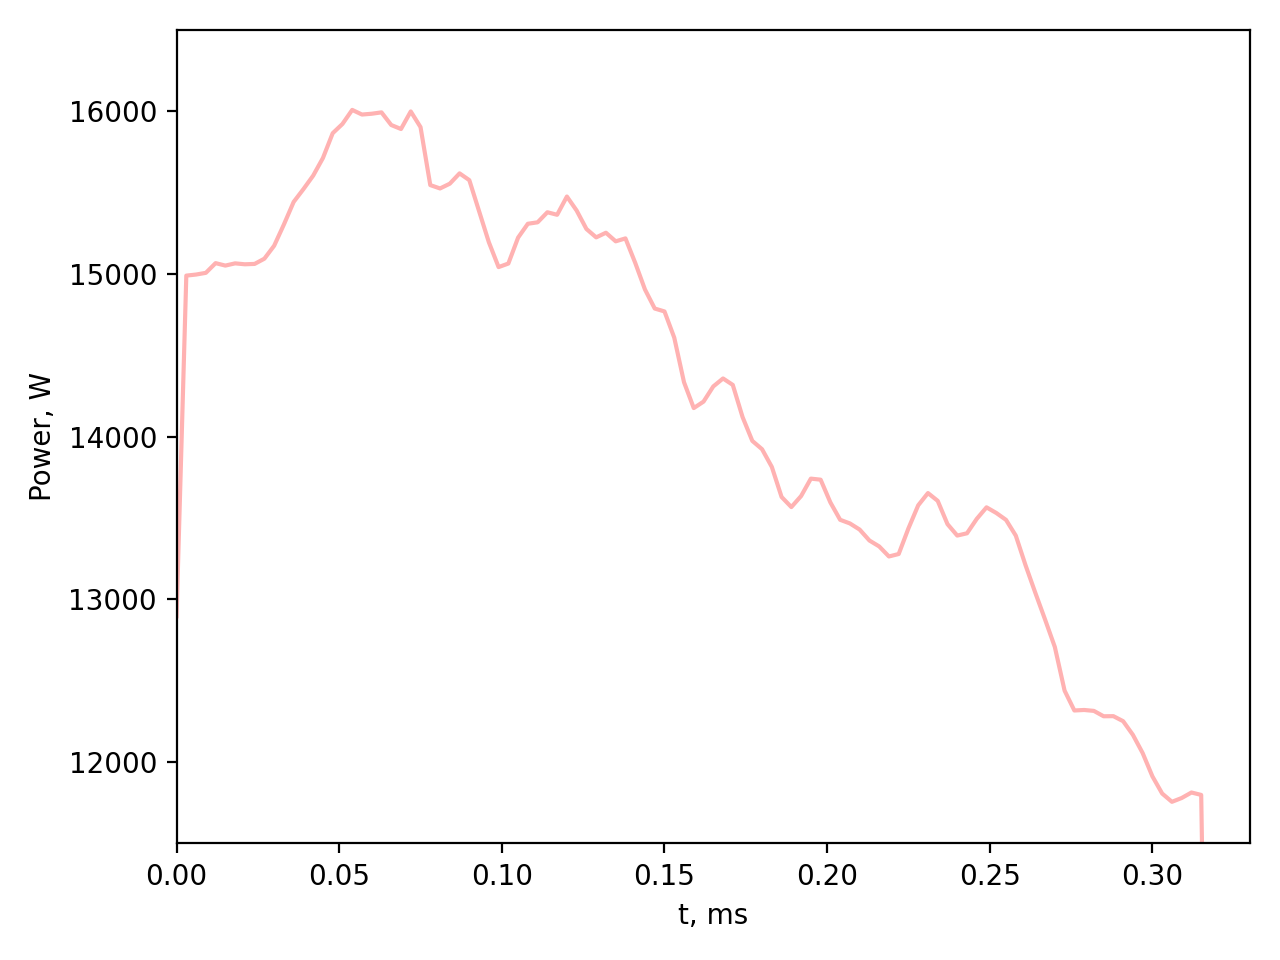
Fig. 53 Sensor data from the Sensors.dat file, last column.