
Porosity Estimation
Goal
Use the included scripts to get quantitative estimates of the presence of pores and other defects of the material
Introduction
The script /opt/KiSSAM/scripts/calcPorosity.x calculates porosity of the VDB file ant outputs 1D, 2D and 3D maps of the resulted geometry bulk densities (and separately for the whole solid region and only for remelted material).
For the analysis:
Get the geometry VDB file.
Find an area where the porosity should be analyzed (box).
Choose the averaging strategy: one value for the whole box; porosity vs x, y, or z axis; 2D or 3D porosity map in the volume.
The script works as follows: The input box is subdivided into voxels, the size of each voxel is defined in the options. In each voxel, the total volume of the voxel, the total volume of the fluid or solid material is found, and the ratio is taken as the estimate of the porosity.
User Case
Let us take ../jsonfiles/Layer04.vdb as an input file.
This is a geometry which was obtained in the 5th layer of a multilayer simulation.
The relevant parameters of the 5th layer simulation are:
'sizes':
  {
  'FullXapprox': 0.01,
  'FullYapprox': 0.01,
  'FullZapprox': 0.005,
  'substrate': 0.0028
  },

'PowderBedGenerator':
  {
  'KnifeZposition': 0.0029,
  ...
  }

'ScanStrategy':
  {
  'Type': 'SquareLayer',
  'SquareLayer':
    {
    'dimX': 0.004,
    'dimY': 0.004,
    'startPosX': 0.003,
    'startPosY': 0.003,
     }
   }
In the first layer, the substrate was at the 2.6 mm position:
'sizes':
  {
  'substrate': 0.0026
  ...
  },

'PowderBedGenerator':
  {
  'KnifeZposition': 0.0027,
  ...
  }
Visual examination
Here is the rendering of the VDB file made in the Blender software.
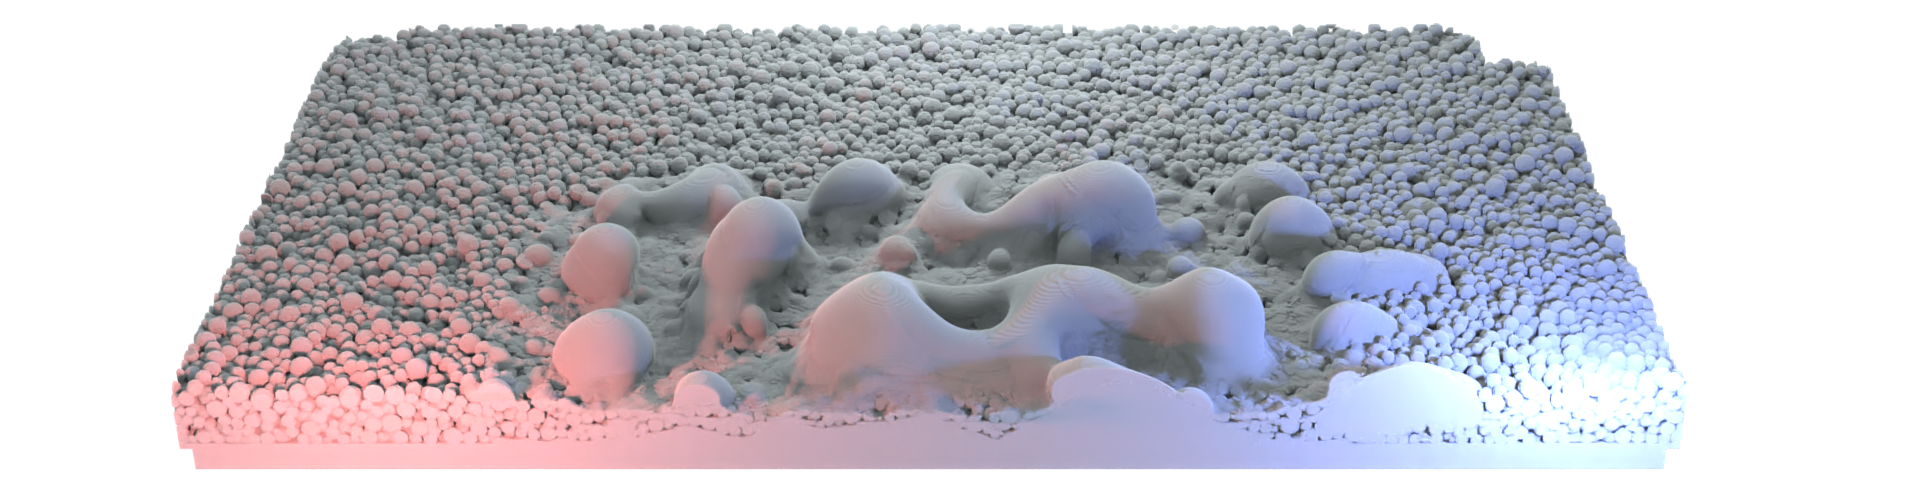
Fig. 54 Rendered volume in the \(0<x<5\) mm area.
Let us look at the cross section of the geometry at the \(x=5\) mm plane.

Fig. 55 Cross section of the sample geometry.
The image was generated with the following command:
$ /opt/KiSSAM-xpt/scripts/drawCrossSection.x Layer04.vdb pic.png --box 5.0,1.0,0 5.0,9.0,5.0 --background E8F0F200 --substrate 295569FF --powder 7F99B2FF --remelted CD86F2FF
Here, the solid material is blue. The solid material which was in the fluid phase during the simulation (remelted solid) is violet.
We see that the manufactured sample has lack of fusion defects. Let us use the included scripts to get the quantitative measure of the
Porosity analysis of the bulk sample
Let us run the script without options:
$ /opt/KiSSAM/scripts/calcPorosity.x Layer04.vdb
# ... Creating assistant Grid to mask above void region  ... # Averaging over the voxels : 1429 1429 714
# progress  .................................................................................................... [100%]
#---------------------------------------------------------------------------
#-----: Total  volume  (w/  pores)    : 500.099946 mm^3
#-----: Remelted volume(w/o pores)    : 0.859497 mm^3
#---------------------------------------------------------------------------
#-----: Total bulk density            : 55.98162 %
#---------------------------------------------------------------------------
The total volume of the geometry is analyzed. The full volume is FullXapprox\(\times\) FullYapprox \(\times\) FullZapprox \(=10\times 10\times 5\text{mm}^3\). The remelted volume is the portion taken by the material that has been in the fluid phase in the simulation of the latest layer. The total portion of the volume taken by fluid or solid material is in the last line of the output.
Let us use the --obviate_above option:
$ /opt/KiSSAM/scripts/calcPorosity.x Layer04.vdb --obviate_above
# ... Creating assistant Grid to mask above void region  ... OK
# Averaging over the voxels : 1429 1429 714
# progress  .................................................................................................... [100%]
#---------------------------------------------------------------------------
#-----: Total  volume  (w/  pores)    : 279.999476 mm^3
#-----: Remelted volume(w/o pores)    : 0.719204 mm^3
#---------------------------------------------------------------------------
#-----: Total bulk density            : 99.98735 %
#---------------------------------------------------------------------------
Here, the empty space above the geometry is not taken in the consideration. The total volume taken by the material is \(\approx 280 \text{mm}^3\), in which 99.99% is filled.
This is not an accurate metric for the porosity of the manufactured part, since a portion of the domain was not touched by the scanning path. To analyze only the relevant geometry, let us specify the box inside the hatched square.
The square is \(\texttt{startPosX}<x<\texttt{startPosX+dimX}\), \(\texttt{startPosY}<y<\texttt{startPosY+dimY}\).
The lowest point of interest is the substrate height of the first layer (if the melt pool was not too deep), and the highest can be any number due to the use of the --obviate_above option.
The box of the relevant geometry is specified with the --box options and two sets of three numbers after it: the x, y, z coordinates of the two corners of the box.
Here, we set the first corner to startPosX, startPosY, substrate (of the first layer simulation), and the second one to startPosX+dimX, startPosY+dimY, FullZapprox
$/opt/KiSSAM/scripts/calcPorosity.x Layer04.vdb --box 3,3,2.6 7,7,5 --obviate_above
# ... Creating assistant Grid to mask above void region  ... OK
# Averaging over the voxels : 571 571 343
# progress  .................................................................................................... [100%]
#---------------------------------------------------------------------------
#-----: Total  volume  (w/  pores)    : 4.253283 mm^3
#-----: Remelted volume(w/o pores)    : 0.668201 mm^3
#---------------------------------------------------------------------------
#-----: Total bulk density            : 99.58787 %
#---------------------------------------------------------------------------
1D porosity maps
Let us find porosity vs. the vertical axis. Here, we set the first corner of the box under analysis to startPosX, startPosY, substrate (оf the first layer simulation), and the second one to startPosX+dimX, startPosY+dimY, FullZapprox. We set a voxel size to the box size in x and y with a key value \(-1\) and to 0.1 in the vertical axis. This way, the box is cut into flat layers in the z axis, and the values for each of the voxels are in the output.
$/opt/KiSSAM/scripts/calcPorosity.x Layer04.vdb --box 3,3,0 7,7,5 --voxel_size -1,-1,0.1
# ... Creating assistant Grid to mask above void region  ... # Averaging over the voxels : 571 571 14
# progress  .................................................................................................... [100%]
#Z-coordinate(mm) TotalVolume(mm^3)   RemeltedVolume(mm^3)    TotalBulkDensity,%
0.049 1.565649        0.000000        100.00000
0.147 1.565649        0.000000        100.00000
0.245 1.565649        0.000000        100.00000
0.343 1.565649        0.000000        100.00000
0.441 1.565649        0.000000        100.00000
0.539 1.565649        0.000000        100.00000
0.637 1.565649        0.000000        100.00000
0.735 1.565649        0.000000        100.00000
0.833 1.565649        0.000000        100.00000
0.931 1.565649        0.000000        100.00000
1.029 1.565649        0.000000        100.00000
1.127 1.565649        0.000000        100.00000
1.225 1.565649        0.000000        100.00000
1.323 1.565649        0.000000        100.00000
1.421 1.565649        0.000000        100.00000
1.519 1.565649        0.000000        100.00000
1.617 1.565649        0.000000        100.00000
1.715 1.565649        0.000000        100.00000
1.813 1.565649        0.000000        100.00000
1.911 1.565649        0.000000        100.00000
2.009 1.565649        0.000000        100.00000
2.107 1.565649        0.000000        100.00000
2.205 1.565649        0.000000        100.00000
2.303 1.565649        0.000000        100.00000
2.401 1.565649        0.000000        100.00000
2.499 1.565649        0.000000        100.00000
2.597 1.565649        0.000000        95.86687
2.695 1.565649        0.006390        86.79318
2.793 1.565649        0.145028        70.70428
2.891 1.565649        0.268455        41.19433
2.989 1.565649        0.281800        20.86604
3.087 1.565649        0.084586        4.85827
3.185 1.565649        0.005081        0.26009
3.283 1.565649        0.000000        0.00000
3.381 1.565649        0.000000        0.00000
3.479 1.565649        0.000000        0.00000
3.577 1.565649        0.000000        0.00000
3.675 1.565649        0.000000        0.00000
3.773 1.565649        0.000000        0.00000
3.871 1.565649        0.000000        0.00000
3.969 1.565649        0.000000        0.00000
4.067 1.565649        0.000000        0.00000
4.165 1.565649        0.000000        0.00000
4.263 1.565649        0.000000        0.00000
4.361 1.565649        0.000000        0.00000
4.459 1.565649        0.000000        0.00000
4.557 1.565649        0.000000        0.00000
4.655 1.565649        0.000000        0.00000
4.753 1.565649        0.000000        0.00000
4.851 1.565649        0.000000        0.00000
4.949 1.565649        0.000000        0.00000
#---------------------------------------------------------------------------
#-----: Total  volume  (w/  pores)    : 79.848096 mm^3
#-----: Remelted volume(w/o pores)    : 0.791339 mm^3
#---------------------------------------------------------------------------
#-----: Total bulk density            : 57.26555 %
#---------------------------------------------------------------------------
For \(z<2.5\) mm, the density is 100% since the voxel is completely in the substrate. For \(z>3.2\) mm, there is no material.
2D porosity maps
Let us make a 2D map of the defect concentration in the layer. To do this, the box is subdivided into voxels, and a value is output for each voxel. The voxel size is specified with the –voxel_size option as three values: the size in the x, y, and z axes. If the value is set to \(-1\), the voxel size in that direction is equal to the size of the whole box. To get a dependency of the porosity on a direction, the size of the voxel in that direction has to be much smaller than the box size in the same direction.
Let us take a box that covers the whole domain in x and y (\(0<x<10\), \(0<y<10\)) and the relevant area of the melted sample in the z axis: \(2.6<z<2.8\). The lower bound 2.6 is taken from the substrate level in the first layer simulation, the upper bound is estimate from Fig. 55 The area of that box is subdivided into voxels with size \(0.2\times 0.2\times 0.1\). This is done with the following command:
$/opt/KiSSAM/scripts/calcPorosity.x Layer04.vdb --box 0,0,2.6 10,10,2.8 --voxel_size 0.2,0.2,-1 > poremap.dat
Where we redirected the output to the text file poremap.dat.
# ... Creating assistant Grid to mask above void region  ... # Averaging over the voxels : 29 29 29
# Total bulk density XY- map
59.93276 62.93821 63.74185 62.33548 ...
....
#---------------------------------------------------------------------------
#-----: Total  volume  (w/  pores)    : 20.085391 mm^3
#-----: Remelted volume(w/o pores)    : 0.076000 mm^3
#---------------------------------------------------------------------------
#-----: Total bulk density            : 68.55905 %
#---------------------------------------------------------------------------
The 2D array in the output is the ratio \(v\) of the volume occupied by solid or fluid material in a voxel to the whole volume of the voxel. The porosity can be estimated as \(100\%-v\). In the comment at the end of the file, the data of the bulk volume of the box is provided.
Let us plot the 2D array with the matplotlib script:
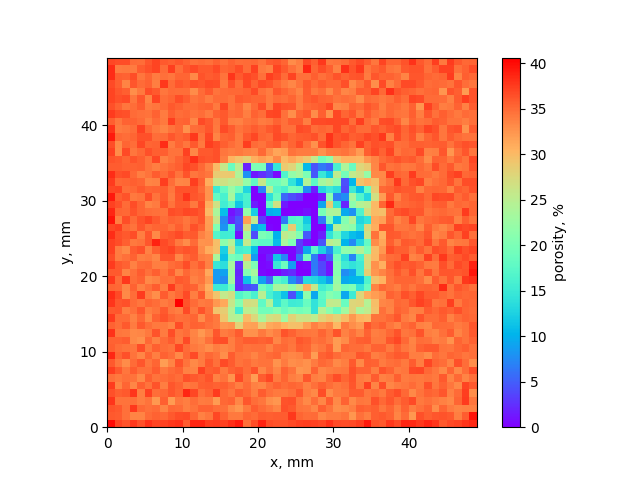
Fig. 56 Plot of the output data
If we repeat the procedure for a more shallow box \(2.6<z<2.7\)
$/opt/KiSSAM/scripts/calcPorosity.x Layer04.vdb --box 0,0,2.6 10,10,2.7 --voxel_size 0.2,0.2,-1 > poremap.dat
some voxels appear denser:
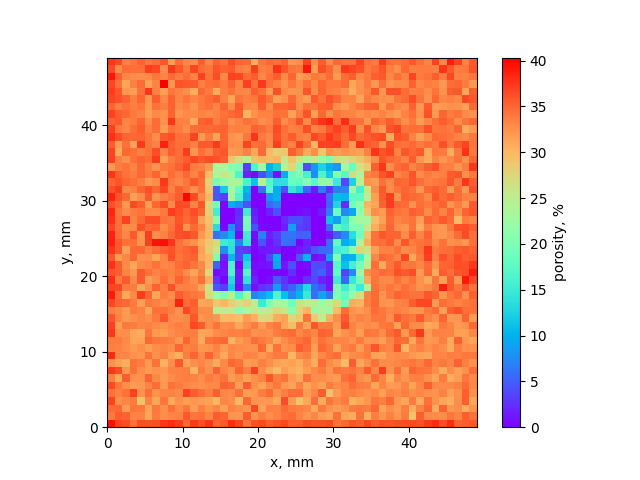
Fig. 57 Plot of the output data
Do not use the --obviate-above option when creating 2D maps. If we take the z range bigger and ignore the area above the sample for the porosity estimation:
/opt/KiSSAM/scripts/calcPorosity.x Layer04.vdb --box 0,0,2.6 10,10,10 --voxel_size 0.2,0.2,-1 --obviate_above > poremap.dat
we get the following result:
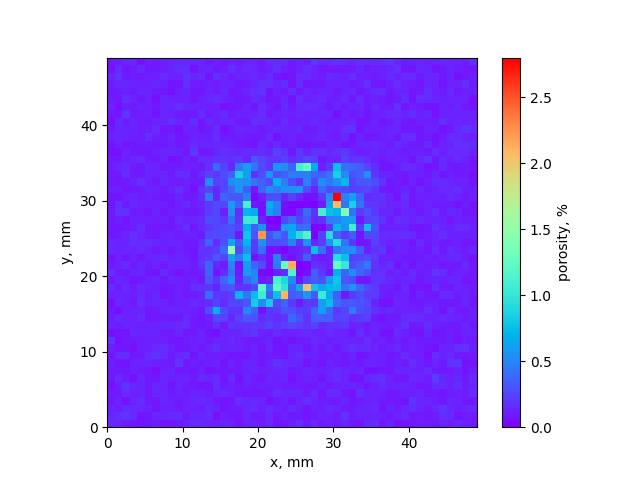
Fig. 58 Plot of the output data
Here, the porosity of powder is 0 since the initial void region is not a pore. The volume of the void that is neglected in the total volume calculation is found with a percolation procedure. The lack of fusion defects are taken into account only if they are trapped inside the sample. The highest porosity value in the last image shows an example of such an occurence.