
Visualize geometry
To visualize the geometry, one may use the drawCrossSection script from the KiSSAM package, or various third party software: vdb_view, Blender, ParaView
In vdb_view
vdb_view is a third-party software, which can be found in the libopenvdb-tools package. You can search for detailed usage online.
vdb_view is a command line utility
> vdb_view geometry.vdb
If you do not have vdb_view in your system, and you have obtained KiSSAM via docker, you can launch vdb_view from the image:
> docker run --gpus all -e USER_ID=$(id -u) -e GROUP_ID=$(id -g) -e DISPLAY=$DISPLAY -v /tmp/.X11-unix:/tmp/.X11-unix:rw --rm -v ./:/calc -it kissam "vdb_view /calc/output/geometry.vdb"
The grid is shown at the start
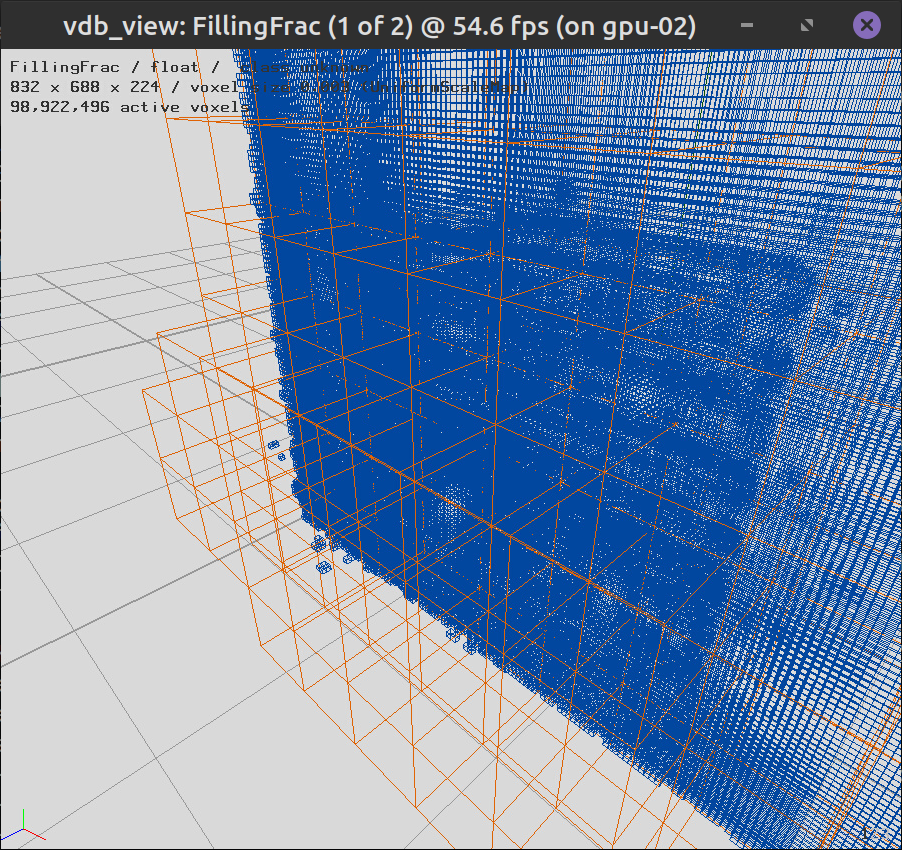
To see geometry press ‘1’ (toggle tree topology view off) and ‘2’ (toggle surface view on) keys on your keyboard.
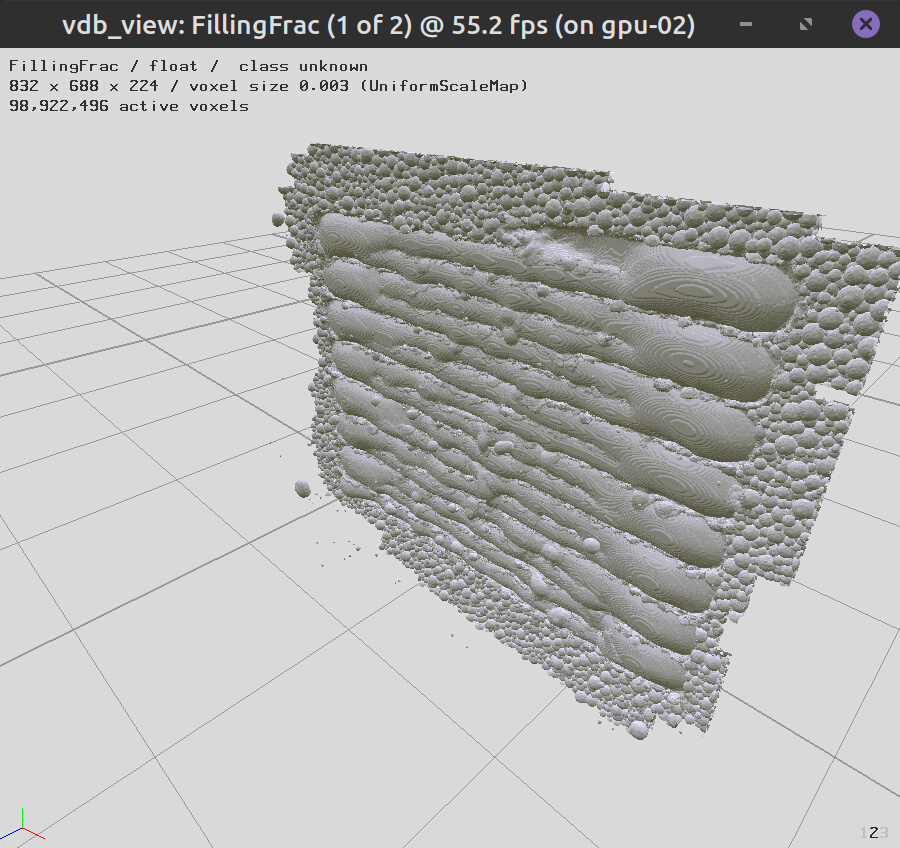
Navigate with mouse
In Blender
Download Blender (free software) from the official website.
Version 4.5 and above can be used.
Open Blender graphical interface.
Click
, select the geometry.vdb file.
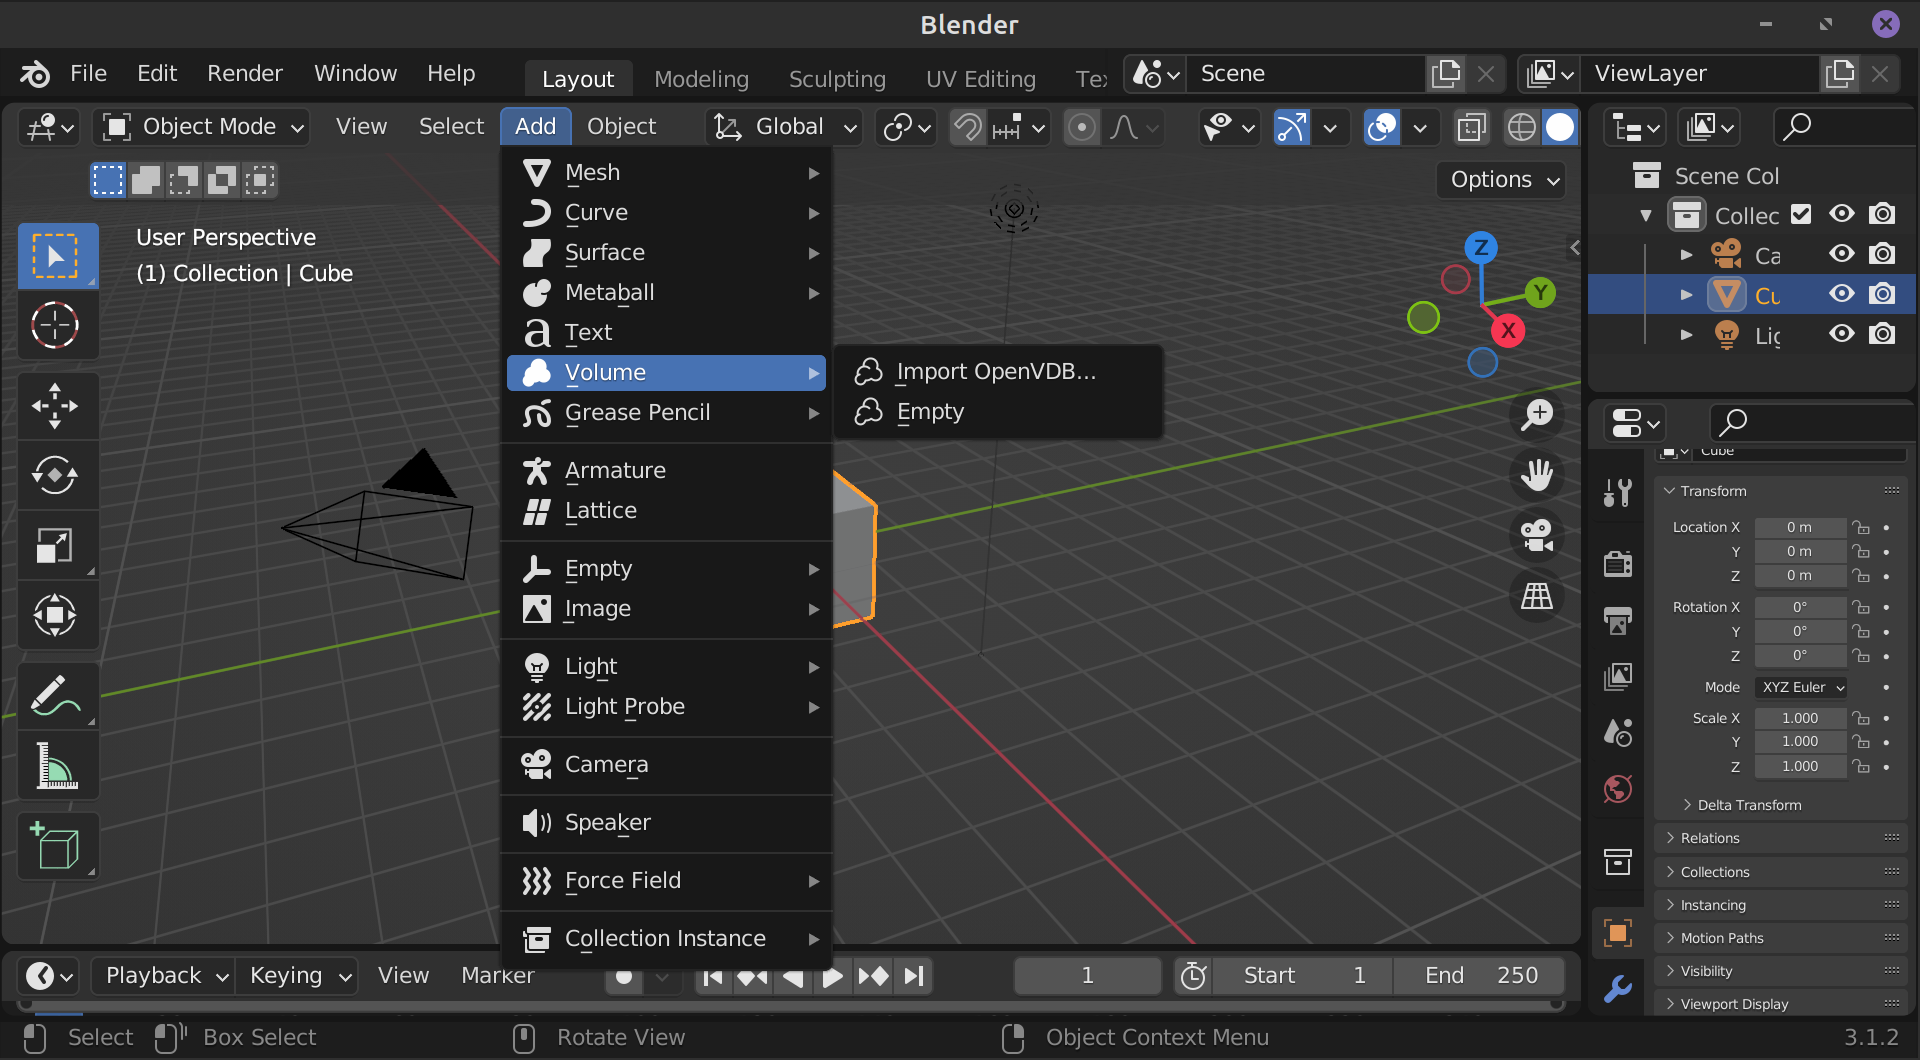
Surface render
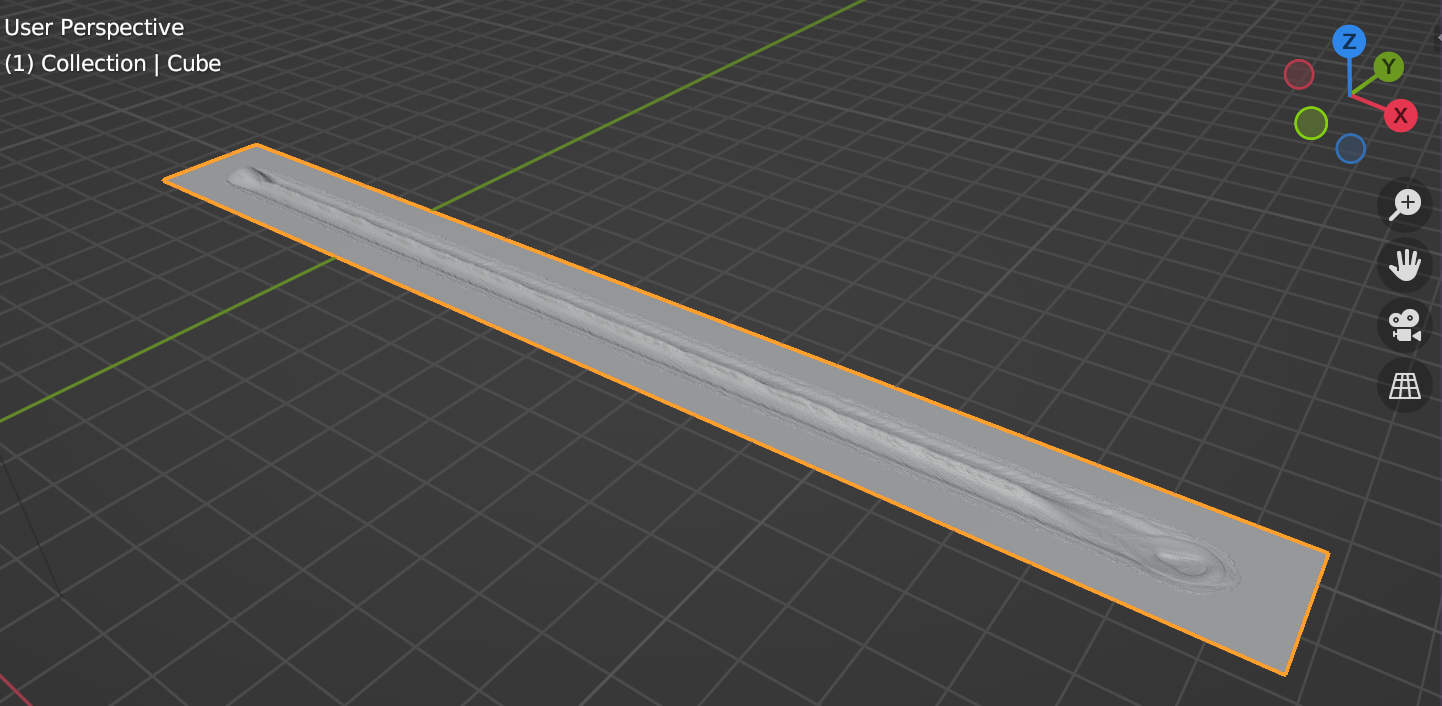
Select the initial cube with left mouse click.
On the panel on the bottom right, select tab. Click
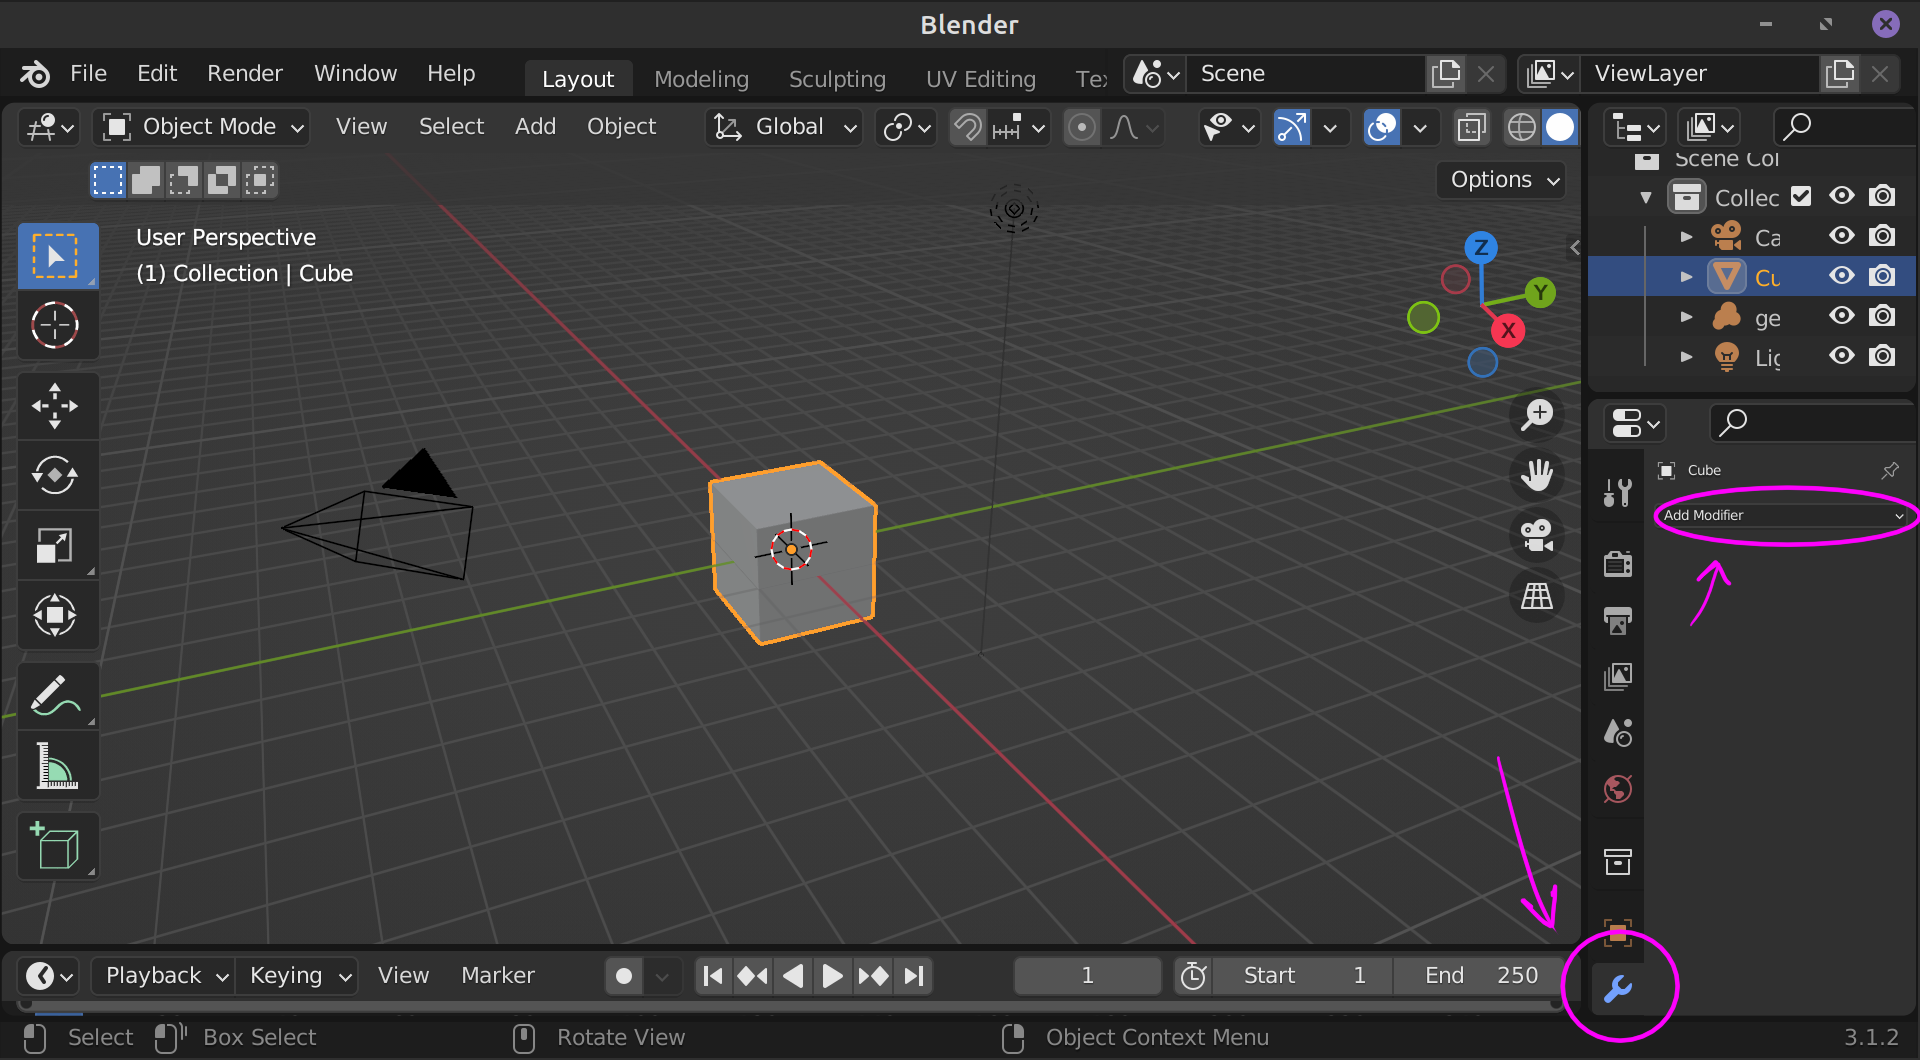
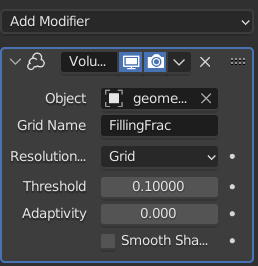
In the Modifier settings, fill in
Object : geometry
Grid Name : FillingFrac
Threshold : 0.5
This will plot the isosurface where FillingFrac\(=0.5\).
The FillingFrac grid is filled with scalar values of \(\varphi\), that is, filling fraction.
\(\varphi=1\) in the mesh cells filled with solid or liquid, and \(\varphi=0\) in the empty cells.
Some cells are partially filled. The isosurface where \(\varphi=0.5\) is a good approximation of the metal surface.
Navigate Viewport with [Numpad .], Middle Mouse, Middle Mouse + Shift, Middle Mouse + Ctrl.
Volume Render Preparation
A VDB file contains velocity and temperature in the melt pool area, as well as grain structure information if the microstucture simulation was turned on in the simulation. These grids may be accessed in Blender for visualization, but it requires some advanced knowledge of the software. Below, we describe some recommended steps for beginners. More features, such as animation and scripting are available for experienced Blender users.
Warning
Note that since Blender is not a scientific software, the treatment of the grids is not very precise. ParaView is recommended if precision and accurate values are important.
Blender Settings
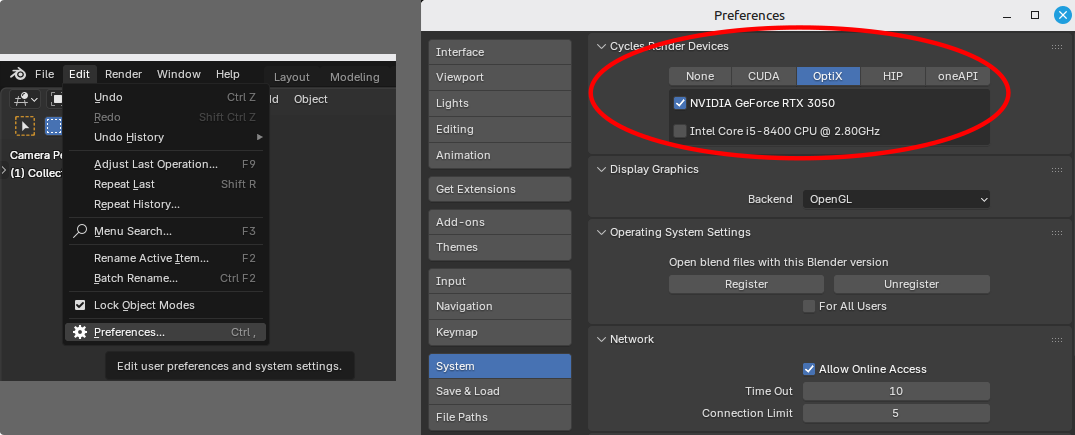
Volume render requires a high-end GPU for best results.
First, check that GPU rendering is turned on in the preferences. Click , select and choose the best render device that is available on your system (CUDA, OptiX, etc..).
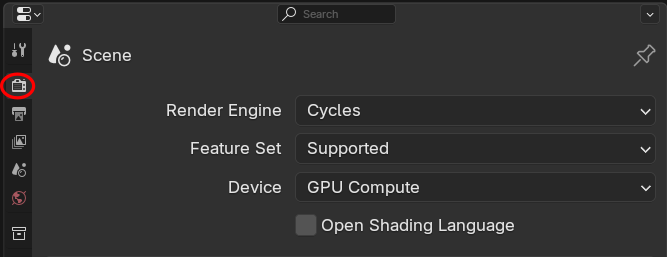
Second, choose GPU render engine in the schene properties.
Activate Grids
VDB grids contain active and inactive cells. This information is used in the KiSSAM simulation, but Blender treats inactive cells as transparent. To visualize inactive grids, it is recommended to preprocess the VDB file with the activateGrids script.
Crop Meshes for Performance
Note that blender treatment of VDB files is not optimized and may be too slow for full meshes. We advise to crop the domain of interest with the activateGrids script.
Here is the sample of a VDB file prepared for Volume Rendering:
/opt/KiSSAM/scripts/activateGrids.x geometry.vdb cropgeometryBF.vdb --crop 0.7,0.7,1.9 6.2,1.3,4
It crops the area \(0.7<x<6.2\), \(0.7<y<1.3\), \(1.9<z<4\) in which the manufactured part is localized.
Load and Inspect The VDB File
Click
, select the geometry.vdb file.
If blender crashes, freezes, or becomes too slow in operation, the VDB file may be too large for your hardware. If no geometry is loaded, the ‘out-of-memory’ error may have occured. You can try to Crop Meshes for Performance.
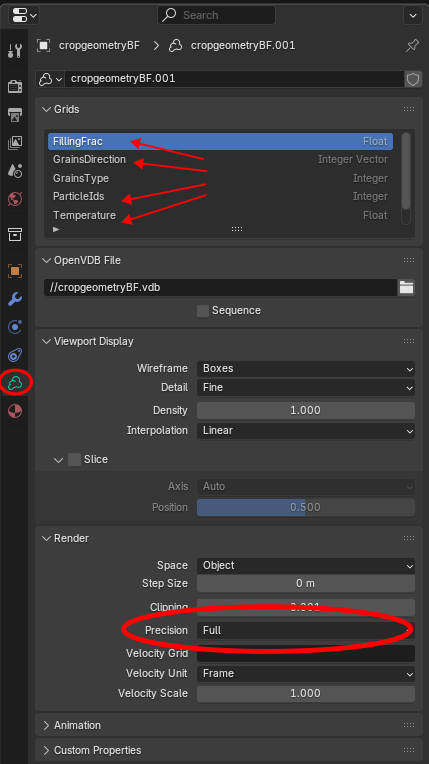
By clicking on various grids (FillingFrac, Temperature, etc.) in the volume data, you can see a rough preview of the grid.
We recommend to set render precision to Full, as shown on the picture.
After that, you can set up the visualization according to your interests. For beginner Blender users, see the sample files below.
Using Sample .blend Files
For users with no previous experience in Blender, we provide sample files. Here is the workflow with a sample .blend file.
Sample .blend file: Grains Structure Cross Sections
Download here.
The version with transparent powder is here.
This file is for inspecting grain structure in single tracks and thin walls.
First, open the .blend file:
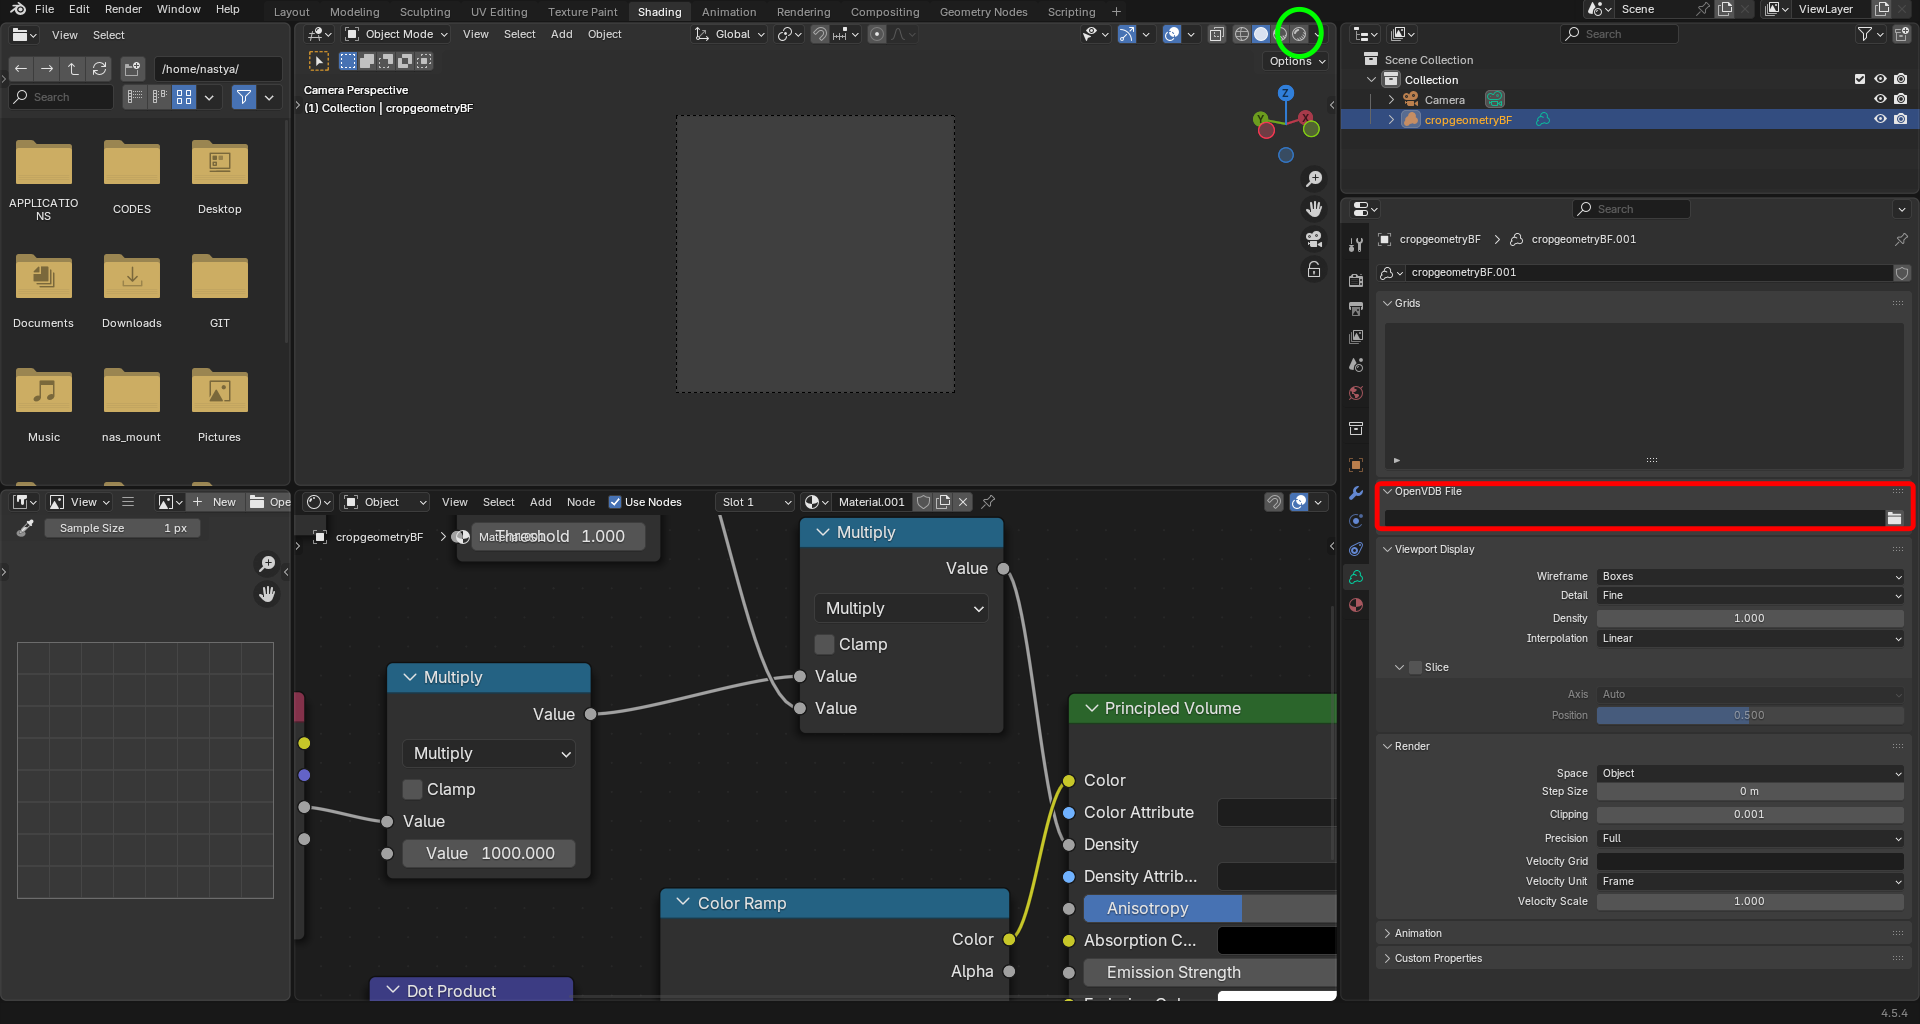
Check the Blender settings section to see if the GPU rendering is enabled. In the window, outlined below with red lines, choose your VDB file. Then click on the icon in the green circle to get a preview.
In the window, outlined below in green, set up the position of the cross-section. The starting y-position of the track in mm is the recommended value.
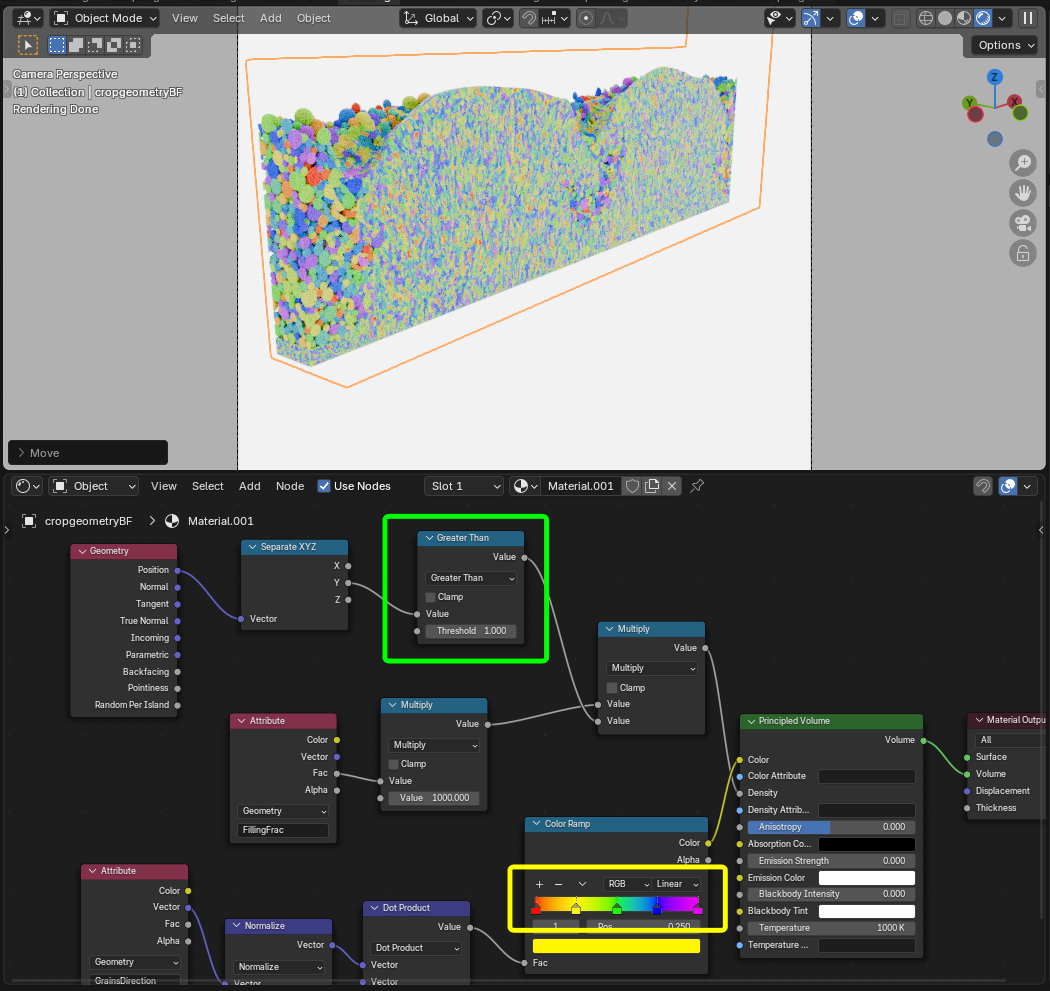
Note that the image is not IPF figure, and serves as a rough illustration of the grain structure. The color shows the angle between the grain orientation and the z-axis, using the color pallete which is outlined in yellow in the image above.